Vizzy

5.0(20 reviews)

Visualize any data with AI-powered ease.

Free

Vizzy Overview

What is Vizzy?

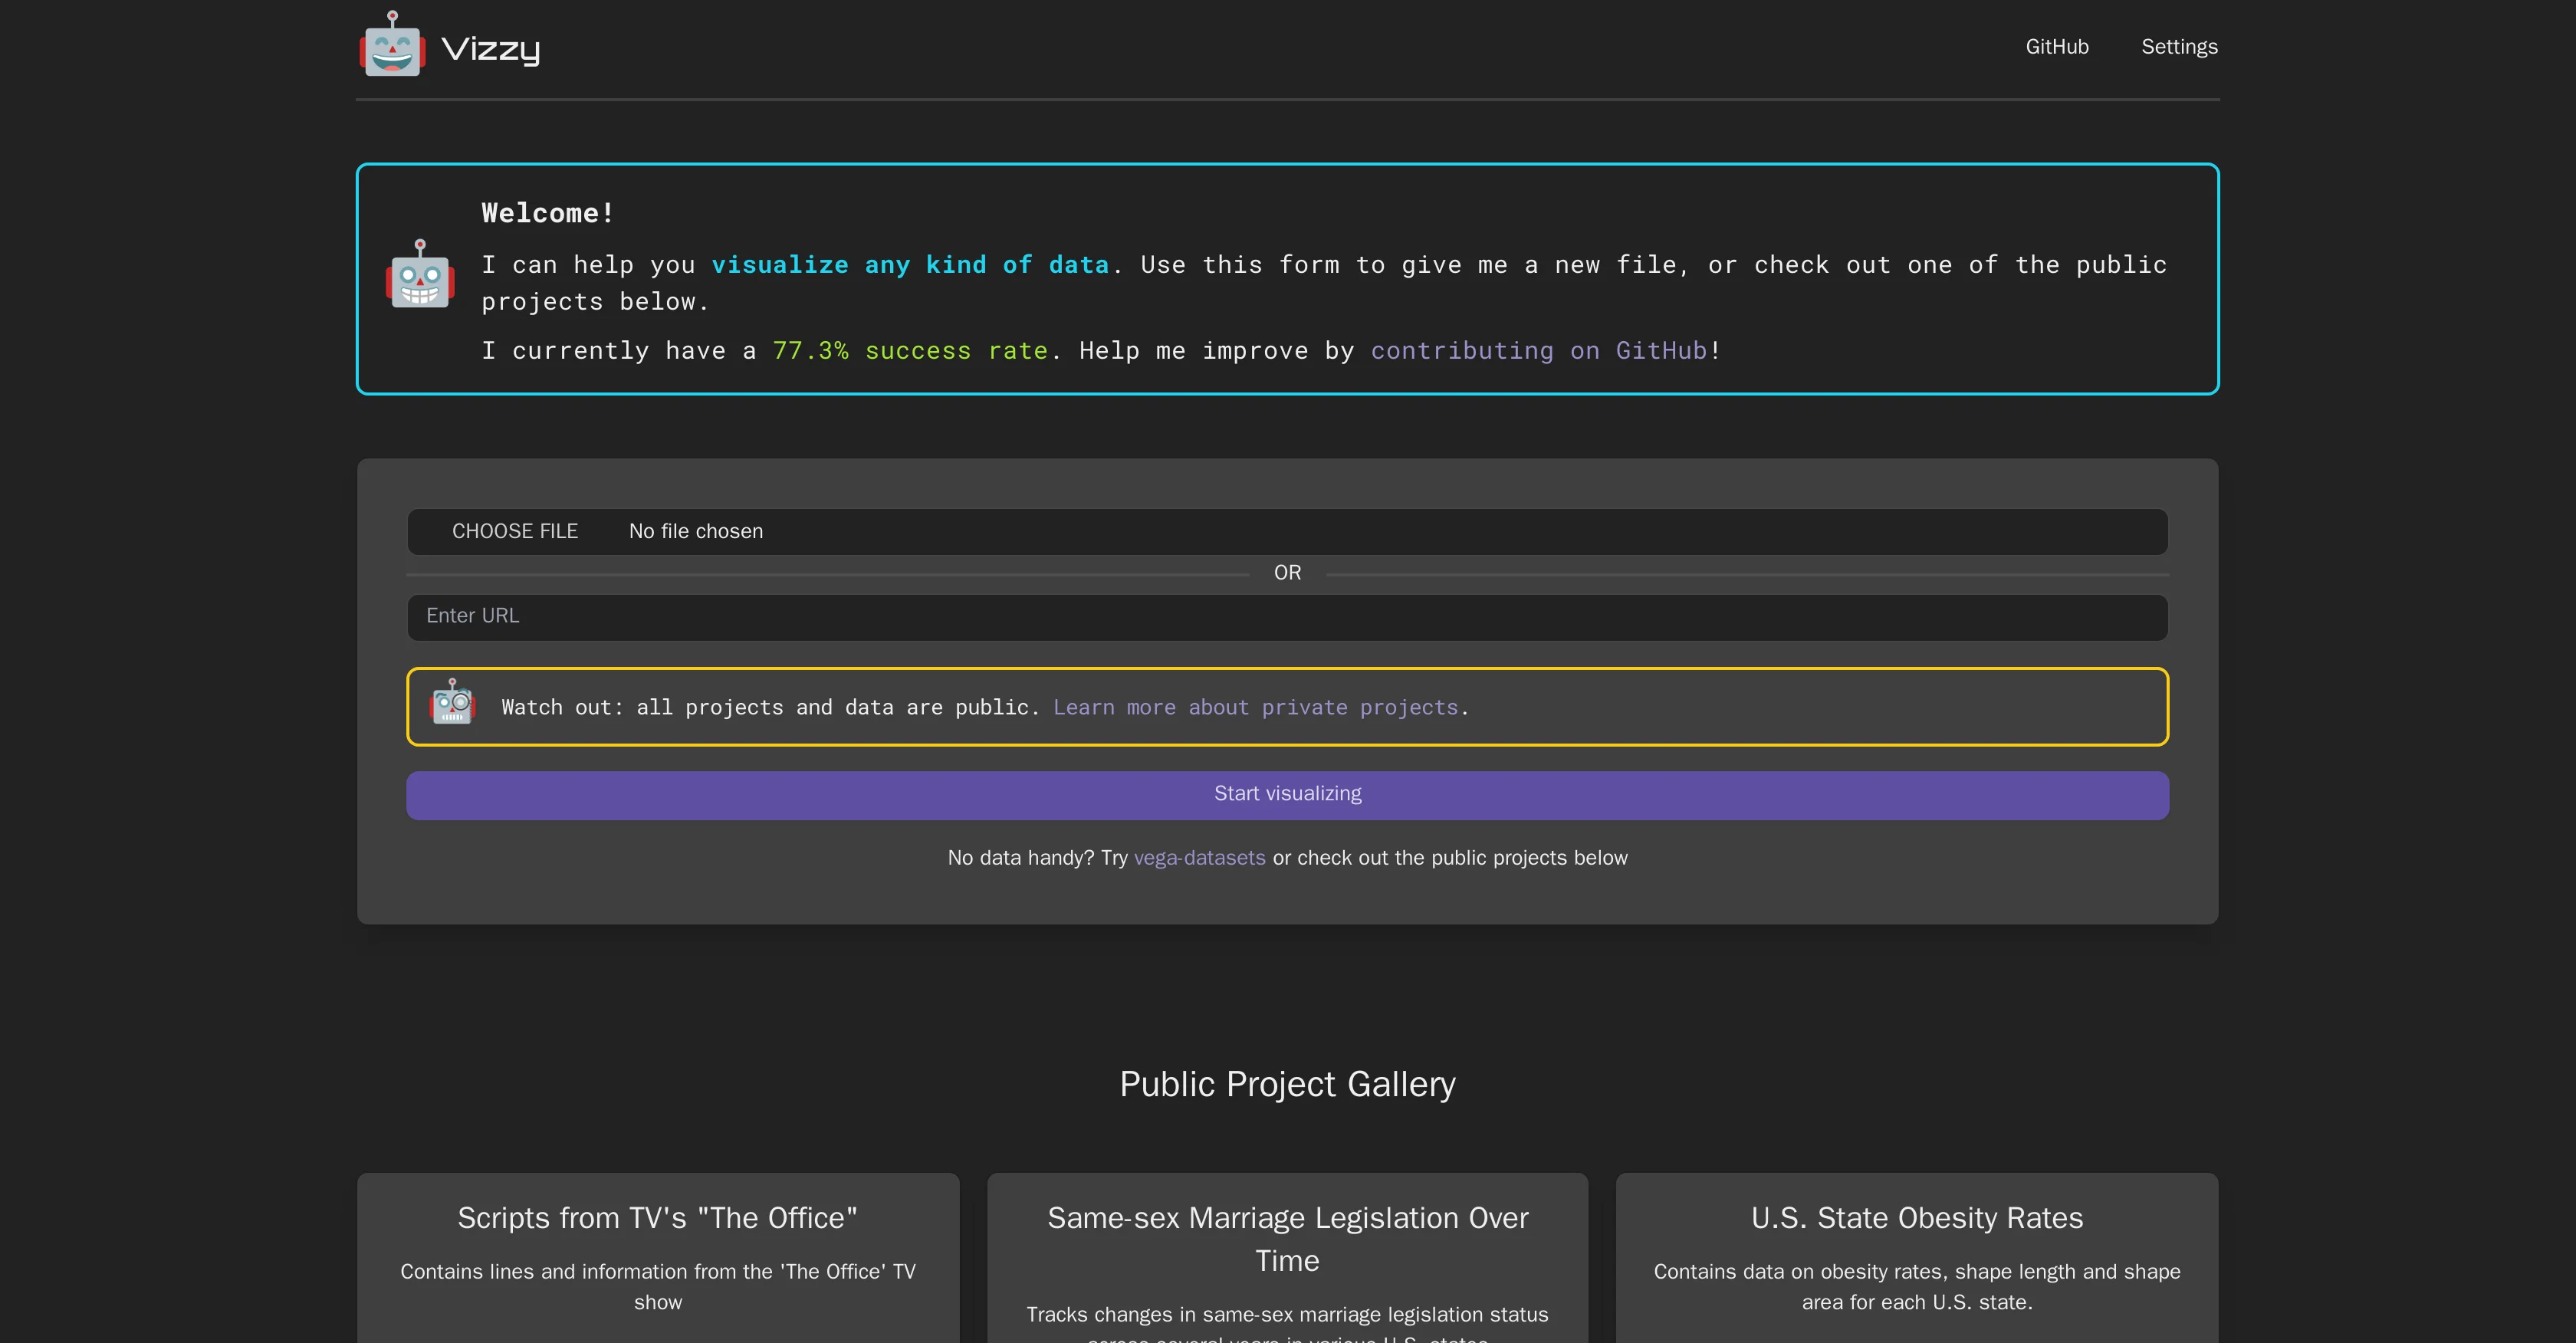
Vizzy is an AI-powered tool designed to help users rapidly visualize data. This tool can be connected to OpenAI via an API token, allowing users to take advantage of OpenAI's suite of AI tools. As a data visualization tool, Vizzy can work with various types of data, making it a versatile choice for diverse fields ranging from public health information to geographic data. Alongside this, Vizzy offers users the option to collaborate on public projects or check out samples from its gallery. With a broad spectrum of application, this tool can be used to track changes in legislation, understand obesity rates in different states or even analyze scripts from television shows. In terms of making use of this tool, users are encouraged to upload their data files for processing. Furthermore, all projects and data used with Vizzy are public, although private project options do exist for users who need them. For those interested in improving this tool, Vizzy encourages contributions on its GitHub page. One key aspect of using Vizzy is that while it is generally a low-cost tool, users are solely responsible for any charges incurred during usage, and are advised to set spending limits on their OpenAI account. Help other people by letting them know if this AI was useful. Add your own prompts and outputs to help others understand how to use this AI.

Screenshot gallery

Vizzy screenshot

Pros & Cons

Pros

  • Rapid data visualization
  • Versatile data type compatibility
  • Allows collaboration on projects
  • Gallery of sample projects
  • Tracks legislative changes
  • Analyzes obesity rates geographically
  • Media script analysis capabilities
  • Supports data file upload
  • Public sharing of all projects
  • Private project options
  • Open source contribution via GitHub
  • User responsible for usage costs
  • Option to set spending limits
  • Broad application spectrum
  • Ability to visualize geographic data
  • Encourages user contribution for improvements
  • Low-cost visualization tool
  • Detailed project samples available
  • Assists in understanding complex data

Cons

  • Requires data file upload
  • User solely covers charges
  • Prominently public projects
  • Limited private project options
  • No own key storage
  • Users' data publicly accessible
  • Not self-hosting friendly
  • Depends on user behavior
  • Charges potentially due to bugs

A Professional Framework to Evaluate Vizzy

When considering Vizzy for integration into your organizational workflow, we recommend deploying a structured score card across three critical operational pillars: Security & Compliance, Integration Friction, and long-term Price Scalability. Rather than looking only at basic feature lists, modern procurement teams must assess how a software platform behaves under high load and how well it fits into the team's data security guidelines.

1. Security and Database Compliance

Depending on your operating region and field, ensure that Vizzy supports standard security layers such as SOC 2 Type II certifications, GDPR compliance, or HIPAA-compliant database encryption. If the tool connects directly to client database tables or handles user passwords, verify that they implement multi-factor authentication (MFA), single sign-on (SSO) integrations, and end-to-end data encryption in transit and at rest.

2. API Coverage and Custom Integrations

Siloed data is the primary cause of operational friction. Evaluate if Vizzy has native connectors for your current project trackers, messaging hubs, and customer communication channels. For custom developer requirements, check if they provide a fully documented REST API with reasonable rate limits, comprehensive Webhooks support, and robust SDK packages in your language. A flexible API layer saves hundreds of hours of manual copy-paste overhead.

3. Total Cost of Ownership (TCO)

SaaS pricing packages are often deceptively simple. When reviewing Vizzy's billing structure, map out your team's projected expansion over the next 12 to 24 months. Determine how costs scale as your customer database increases or as you add team members. Factor in setup costs, mandatory support plan upgrades, API access fees, and storage overage rates to understand the true cost before committing to a contract.

By combining verified user reviews from our directory with internal workflow pilot tests, your procurement team can make an informed decision that drives productivity without creating capital waste.

Features of Vizzy

  • DataVisualization
  • OpenAI
  • ArtificialIntelligence
  • MachineLearning
  • Collaboration
  • PublicProjects
  • Free

SaaS1to10 verified reviews for Vizzy

Overall rating

5.0

Based on 20 reviews

5.01 weeks ago

Review

Thanks for the feedback, and also for the tip for the community. One more tip: if you upload an image directly, you can add context that might be missing in the image. For example, the duration is 3 hours or prefix every event title with Name:

Caren Cioffi

5.01 weeks ago

Review

Easy to implement into my workflow and helps save time reviewing and drafting various legal documents

Meaghan Hounslow

5.01 weeks ago

Review

Big time saver but the download file is not very friendly

Paul Mercer

5.01 weeks ago

Review

It is not free. So i couldnt test anything

Isa Venancio

5.01 weeks ago

Review

I rarely leave reviews, but Elsa amazed me. After a few weeks of using it, I'm still excited. Props, guys.

Anton

5.01 weeks ago

Review

Useful tool for visualizing traffic flowing through your website. Does what GA4 does but without the headache and unnecessary learning curve.

Nic Miller

5.01 weeks ago

Review

i would say it gives the mind a sense of clarity

Emmanuella Marshall

5.01 weeks ago

Review

I joined Kin's beta program on my iPhone XR. After upgrading to an iPhone 13, I found that I couldn't log into my existing account on the new phone, forcing me to create a new account. Now, I have two separate Kin accounts on different phones. Today, when I accessed the beta version of Kin, I got a notification stating that the test version ended on Monday, September 23rd. It instructed me to back up my data and move to the official Kin app. I did as advised—backed up my data, confirmed, uninstalled the beta app via TestFlight, and installed the official Kin app. However, when I attempted to “log in”, I was still unable to access my existing account. This issue hasn't been resolved yet. I have been trying desperately to get in contact with the support team. I left feedback through the test flight app and sent emails. No response. Now trying to find a forums, Reddit posts, TAAFT comments☻

Desiree Miller

5.01 weeks ago

Review

We will give you guys a go! thanks!

Silent Co

5.01 weeks ago

Review

I tried using it but the website has too many bugs.

João Neiva

5.01 weeks ago

Review

after playing around with it for a bit, i am now aware of how much i need this. i can already feel the hours of sleep coming back to me <3

Bru no no no

5.01 weeks ago

Review

I really like @DataLine, but I'm kinda biased cause I built it.

Rami Awar

5.01 weeks ago

Review

Signed up for a pro account for Google Drive integration. Works great! Saves me a lot of manual excel work.

Thu Ha Vu

5.01 weeks ago

Review

I've been playing around with this for a few hours. It's made me say "WOW" too many times than i wish to admit. I'm going to follow this and see how it evolves. For now, i managed to create quite a nice Expenses app for personal use. | It did have some problems when it came to moving some components on other pages, but for how short the prompts it uses can be, it is really impressive. With some proper prompts it can generate some strong stuff.

Bernard

5.01 weeks ago

Review

It's genius. Amazing tool. PDF generation might be improved, but apart from that is amazing.

Aleksander Lukashou

5.01 weeks ago

Review

It is the ease of use for me. @DataSquirrel is fast, the UI is super intuitive, and the guided analysis feature is highly convenient. I have officially moved from uploading CSV files from Google sheet to @DataSquirrel. Within minutes, I can visualize my data and interpreting it becomes super simple.

Aakriti Mahajan

5.01 weeks ago

Review

I'm still testing the tool yet it looks very promising. I tested it with a 5.5k words Academic text that I had previously red. I tested the Key points feature, it does work!

Ivana González

5.03 weeks ago

Review

I was just trying to get a quick graph showing population evolution over the last 30 years, didn’t have the dataset ready, so I was hoping the tool could auto-fill something reasonable. But it literally gave me three values. Three?? For 30 years?? What kind of trend can I possibly see with that? If the tool offers to research the data, it should at least offer a full timeline. And when I pasted the data I found, it created a literally bar chart???

Curtis Walls

5.03 weeks ago

Review

it is an excellent innovation

UNNAM SAI CHARAN

5.03 weeks ago

Review

I felt there is need of more ready made templates. But, it does what it claims. I chose one question suggested by the AI agent, and it created the infographics in few seconds. It's cool. Saving it for future reference.

Harrison Oliver

Pricing

Starting Price

Free plan available

Free tier available with optional paid upgrades.

Where can Vizzy be deployed?

  • Cloud, SaaS, Web-Based

Recommended for you