5.01 months ago
“Review”
We are launching first of its kind AI Vision Search App.
Dos James

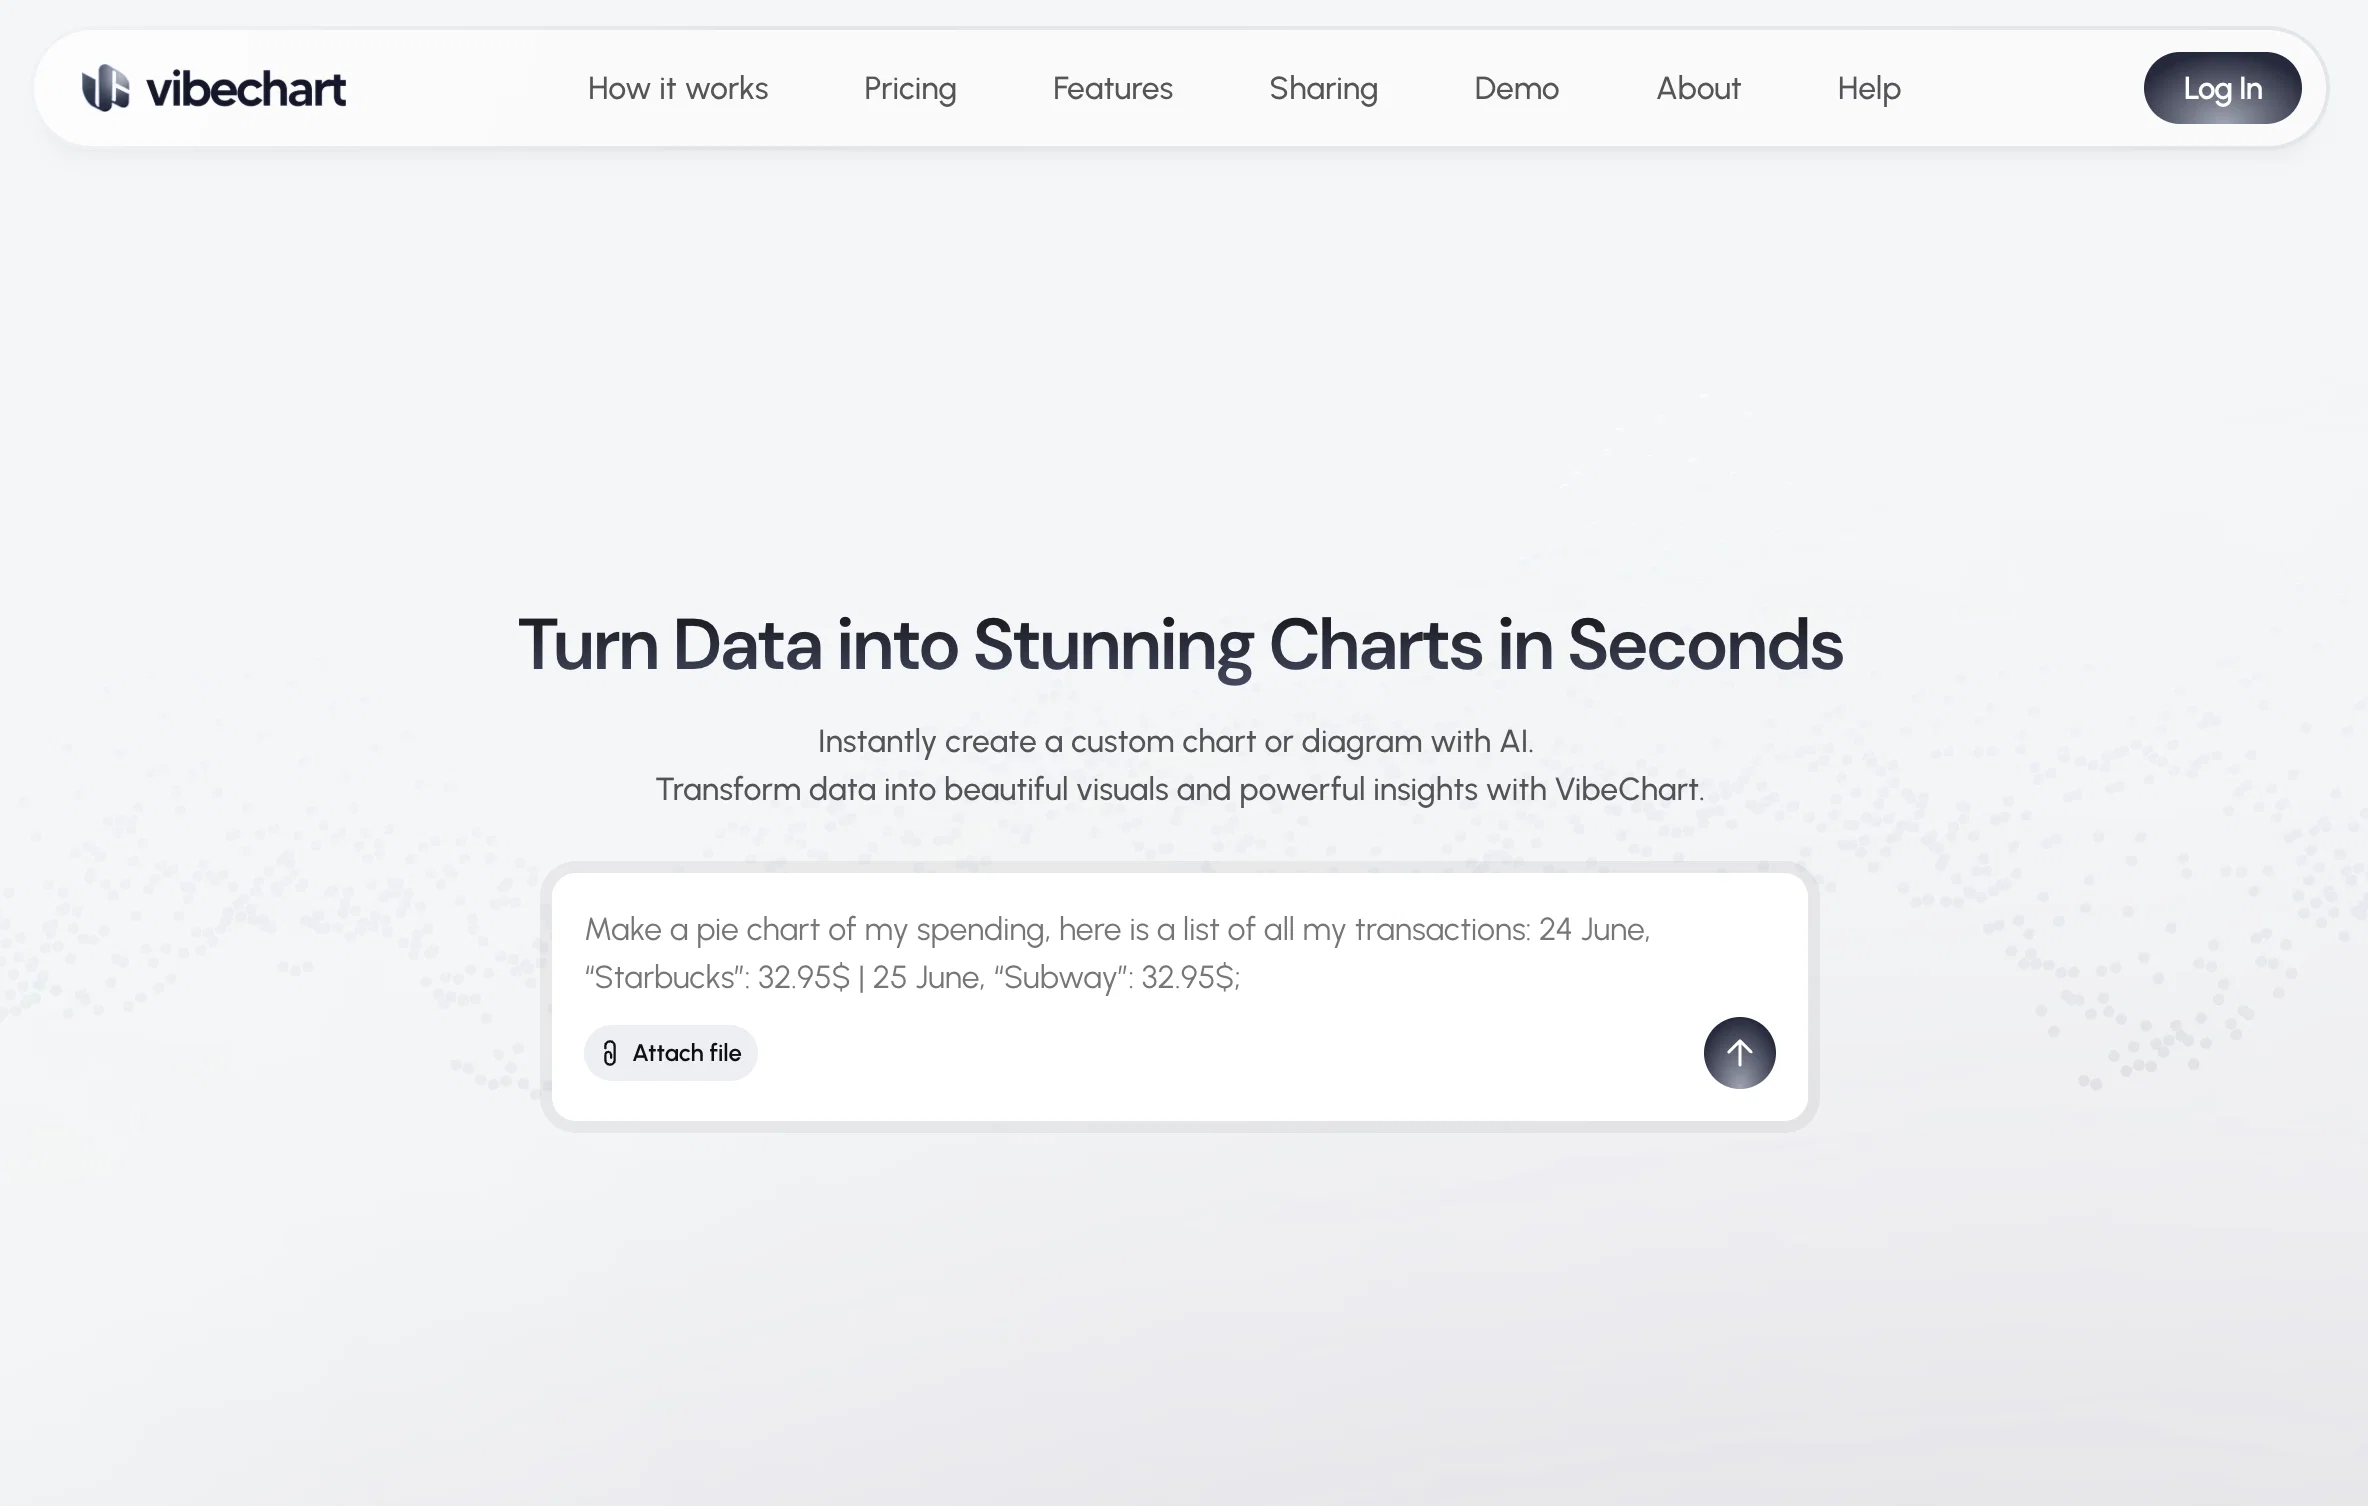
Turn Data into Stunning Charts in Seconds
VibeChart is an AI-enabled tool that is designed to turn data into visually appealing and insightful charts or diagrams instantly. Its key feature includes a unique 'Text-to-Chart' interface that allows users to create and customize over 40 types of charts using plain language and natural data queries. This offers speed, flexibility, and precision to the users while generating these visuals. The tool is equipped with a built-in data engineer to clean, transform, and extract insights from messy data using smart, instructable tools. VibeChart provides high-speed, reliable chart generation through an API, promising high uptime and quick response times. The charts created can be easily shared across multiple platforms as the tool offers the flexibility to export the chart as an image, link, or embedded code. This makes it accommodating for various business and research needs, across different domains like data analytics, product management, surveys, consulting, accounting, investments, and quality assurance, among others. VibeChart helps to eliminate time-consuming manual charting, enabling users to visualize their data smarter and faster. Help other people by letting them know if this AI was useful. Add your own prompts and outputs to help others understand how to use this AI.
When considering VibeChart for integration into your organizational workflow, we recommend deploying a structured score card across three critical operational pillars: Security & Compliance, Integration Friction, and long-term Price Scalability. Rather than looking only at basic feature lists, modern procurement teams must assess how a software platform behaves under high load and how well it fits into the team's data security guidelines.
Depending on your operating region and field, ensure that VibeChart supports standard security layers such as SOC 2 Type II certifications, GDPR compliance, or HIPAA-compliant database encryption. If the tool connects directly to client database tables or handles user passwords, verify that they implement multi-factor authentication (MFA), single sign-on (SSO) integrations, and end-to-end data encryption in transit and at rest.
Siloed data is the primary cause of operational friction. Evaluate if VibeChart has native connectors for your current project trackers, messaging hubs, and customer communication channels. For custom developer requirements, check if they provide a fully documented REST API with reasonable rate limits, comprehensive Webhooks support, and robust SDK packages in your language. A flexible API layer saves hundreds of hours of manual copy-paste overhead.
SaaS pricing packages are often deceptively simple. When reviewing VibeChart's billing structure, map out your team's projected expansion over the next 12 to 24 months. Determine how costs scale as your customer database increases or as you add team members. Factor in setup costs, mandatory support plan upgrades, API access fees, and storage overage rates to understand the true cost before committing to a contract.
By combining verified user reviews from our directory with internal workflow pilot tests, your procurement team can make an informed decision that drives productivity without creating capital waste.
Overall rating
Based on 19 reviews
We are launching first of its kind AI Vision Search App.
Dos James
Nice good better than before
Rehankhan Shamim
@GPT Trainer is run by a highly responsive management team and support staff. Questions are answered quickly, feature requests are incorporated quickly. We have multiple chatbots that are live with GPT Traner, including for Healthcare, hospitality and solar energy providers. We highly recommend for both value and quality.
John Griffith
Easy to start and made a customer support agent for my website in a few minutes!
PeersIdea Inc.
UI Experience is fast & good with free account limited data (100 csv records) but no 3rd party integrations and limited data connection and no 3D /funnel many more chart visualizations are missing.
Poojitha Bandaru
Awesome tool! I have crafted my own tool, but @Syft is the best!
Jonathan Bahu
Signed up for a pro account for Google Drive integration. Works great! Saves me a lot of manual excel work.
Thu Ha Vu
@BotDojo is one of the most powerful AI Agent builders I've found out there. As a non-technical marketer, it took me a minute to get familiar with the designer, but using the preexisting templates is super helpful! I am now running outreach 100% on autopilot. @BotDojo personalizes the copy for each contact we reach out to by email and LI. It also takes care of the drip campaign that I run through Lemilist. LOVE IT! I really hope to see more templates coming up soon!
Antoine Vial
Just implemented your instruction out how to run drip campaigns automatically, nice! Getting prospect calls coming in
Jenn N.
This tool finally helps me understand what makes a great prompt. It doesn't just give me a better version, it shows me to get there by analyzing why the original prompt is weak and showing what to improve. The difference this makes to the final AI output is incredible. An essential tool for getting more accurate and detailed results, Great Job!
Milo Quinn
I think it's the best @Image Generator I ever found on the net. It gives more accurate image according to the prompt. And thank you for keeping it for free.
My Sawsiri
Generate decks in seconds that are indistinguishable from top consulting firms. Using only verified data and credible sources. Xavier specializes exclusively in business and consulting presentations, unlike general AI presentation tools.
Joao Filipe
Thanks a lot for giving our tool a try and for the honest feedback - really appreciate it! Sorry to hear it didn’t feel different from what you’re already using, but I have an idea: how about we take one of your ICPs and do a side-by-side comparison with Lusha? I’m 100% sure we’ll beat them in terms of relevant contact density. Feel free to drop your ICP here or DM me.
Vladimir
This smells like Product of the Year material.
Brooklyn Campbell
I was just trying to get a quick graph showing population evolution over the last 30 years, didn’t have the dataset ready, so I was hoping the tool could auto-fill something reasonable. But it literally gave me three values. Three?? For 30 years?? What kind of trend can I possibly see with that? If the tool offers to research the data, it should at least offer a full timeline. And when I pasted the data I found, it created a literally bar chart???
Curtis Walls
It is a smooth way to go from messy data to clean visuals. Minor nit: big, unstructured files still benefit from a quick tidy or a more specific prompt but the overall flow feels strong. It's really great for data lovers
Elias Skrt
good nothing more to say just very good
yves Anguilet
it is an excellent innovation
UNNAM SAI CHARAN
I felt there is need of more ready made templates. But, it does what it claims. I chose one question suggested by the AI agent, and it created the infographics in few seconds. It's cool. Saving it for future reference.
Harrison Oliver
Starting Price
Free plan available
Free tier available with optional paid upgrades.