5.02 months ago
“Review”
We're looking to rollout major integrations for Google Search Console and Bing within the coming week. Contact us for more information on our roadmap!
New Odyssey

Monitor, analyze, and act faster with AI-powered observability.
Grafana Cloud is an AI-powered observability tool designed to streamline the process of monitoring and analyzing team's data in real-time. It offers open-source solutions that enable you to monitor application performance and ensures infrastructure health. With the provision of logging, visualization, tracing, and metrics capabilities, it helps in identifying anomalies, conducting root cause analysis, creating Service Level Objectives (SLOs), and triggering alerts. It also offers comprehensive application performance monitoring, infrastructure observability, performance testing and synthetic monitoring. Grafana Cloud provides features for incident response and on-call management, automating routine tasks and ushering in flexible management during incidents. Its solutions are designed to include monitoring integrations with technologies such as Linux, Windows, Docker, PostgreSQL, MySQL, AWS, Kafka, Jenkins, RabbitMQ, MongoDB, Microsoft Azure, and Google Cloud. The platform supports a wide array of data sources and offers visualization integrations with MongoDB, AppDynamics, Oracle, GitLab, Jira, Salesforce, Splunk, Datadog, New Relic, and Snowflake among others. Committed to enhancing the ease and speed of onboarding and minimizing vendor lock-in, it aims to help teams work smarter across the observability journey. Help other people by letting them know if this AI was useful. Add your own prompts and outputs to help others understand how to use this AI.
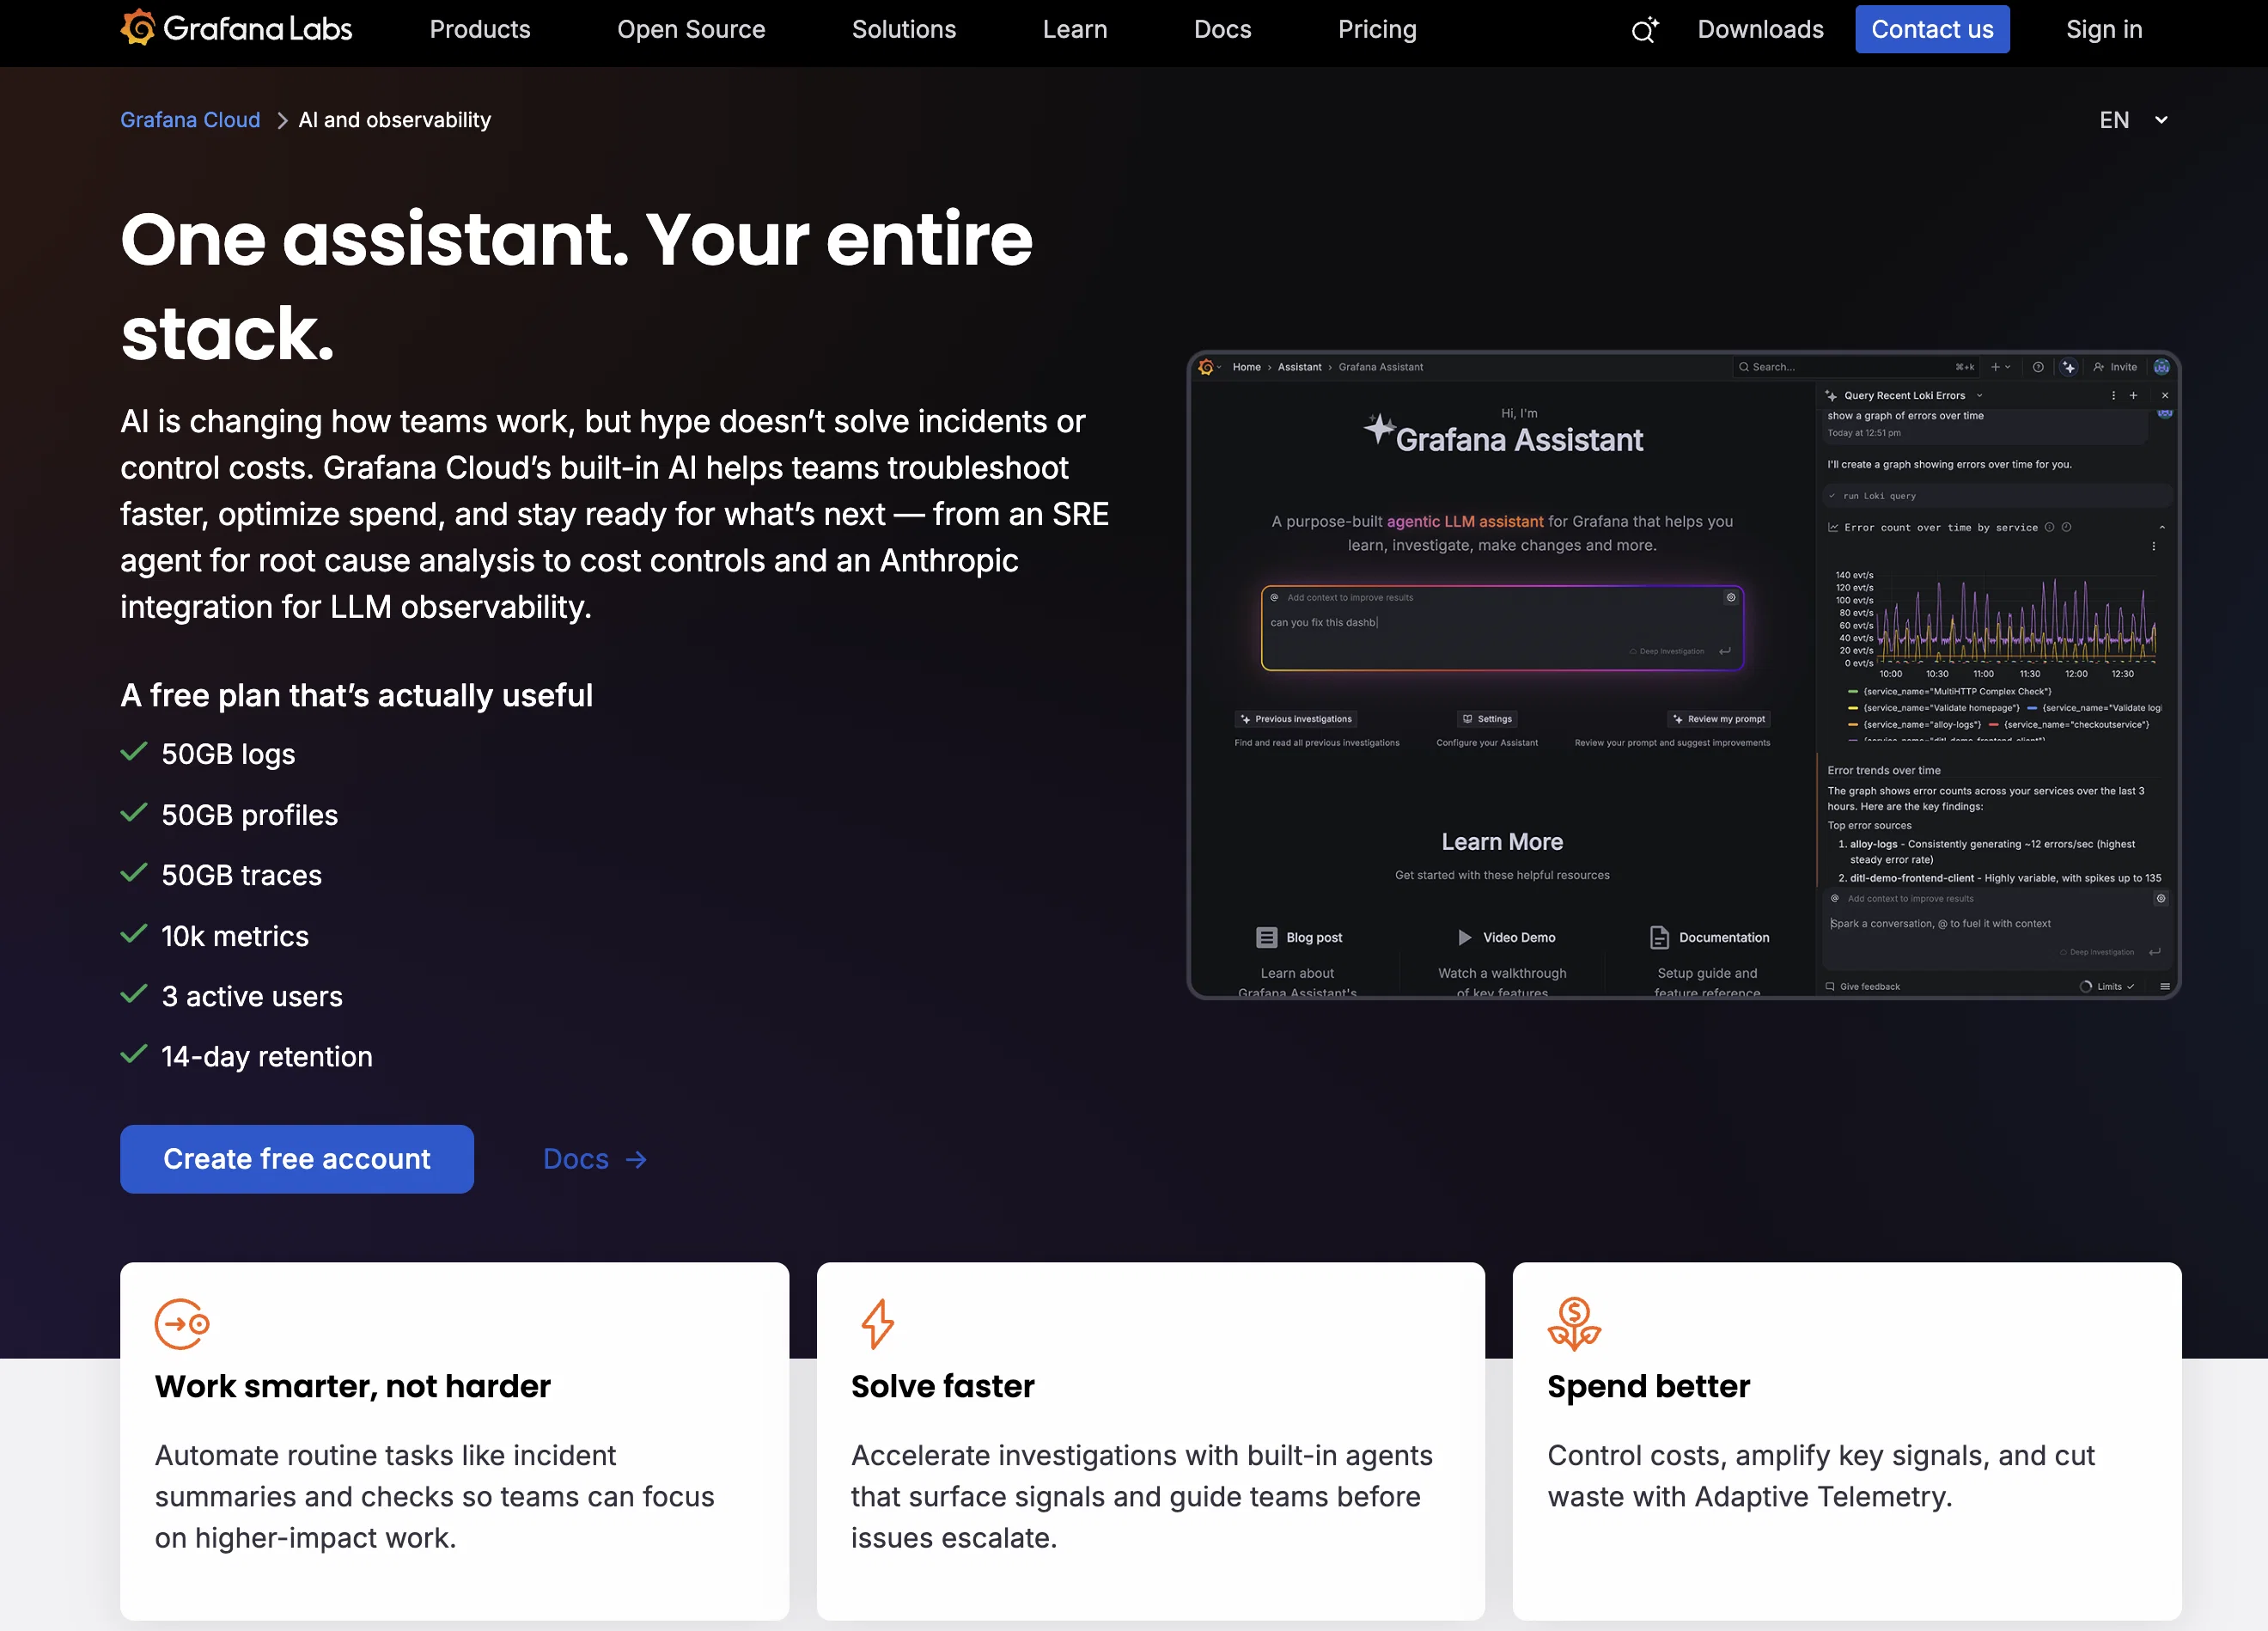
When considering Grafana Assistant for integration into your organizational workflow, we recommend deploying a structured score card across three critical operational pillars: Security & Compliance, Integration Friction, and long-term Price Scalability. Rather than looking only at basic feature lists, modern procurement teams must assess how a software platform behaves under high load and how well it fits into the team's data security guidelines.
Depending on your operating region and field, ensure that Grafana Assistant supports standard security layers such as SOC 2 Type II certifications, GDPR compliance, or HIPAA-compliant database encryption. If the tool connects directly to client database tables or handles user passwords, verify that they implement multi-factor authentication (MFA), single sign-on (SSO) integrations, and end-to-end data encryption in transit and at rest.
Siloed data is the primary cause of operational friction. Evaluate if Grafana Assistant has native connectors for your current project trackers, messaging hubs, and customer communication channels. For custom developer requirements, check if they provide a fully documented REST API with reasonable rate limits, comprehensive Webhooks support, and robust SDK packages in your language. A flexible API layer saves hundreds of hours of manual copy-paste overhead.
SaaS pricing packages are often deceptively simple. When reviewing Grafana Assistant's billing structure, map out your team's projected expansion over the next 12 to 24 months. Determine how costs scale as your customer database increases or as you add team members. Factor in setup costs, mandatory support plan upgrades, API access fees, and storage overage rates to understand the true cost before committing to a contract.
By combining verified user reviews from our directory with internal workflow pilot tests, your procurement team can make an informed decision that drives productivity without creating capital waste.
Overall rating
Based on 2 reviews
We're looking to rollout major integrations for Google Search Console and Bing within the coming week. Contact us for more information on our roadmap!
New Odyssey
We're LIVE :)
Ezzaky Ab.
Starting Price
Free plan available
Free tier available with optional paid upgrades.