ChartGen
Transform data into professional charts in seconds.
ChartGen Overview
What is ChartGen?
Help other people by letting them know if this AI was useful. Add your own prompts and outputs to help others understand how to use this AI.
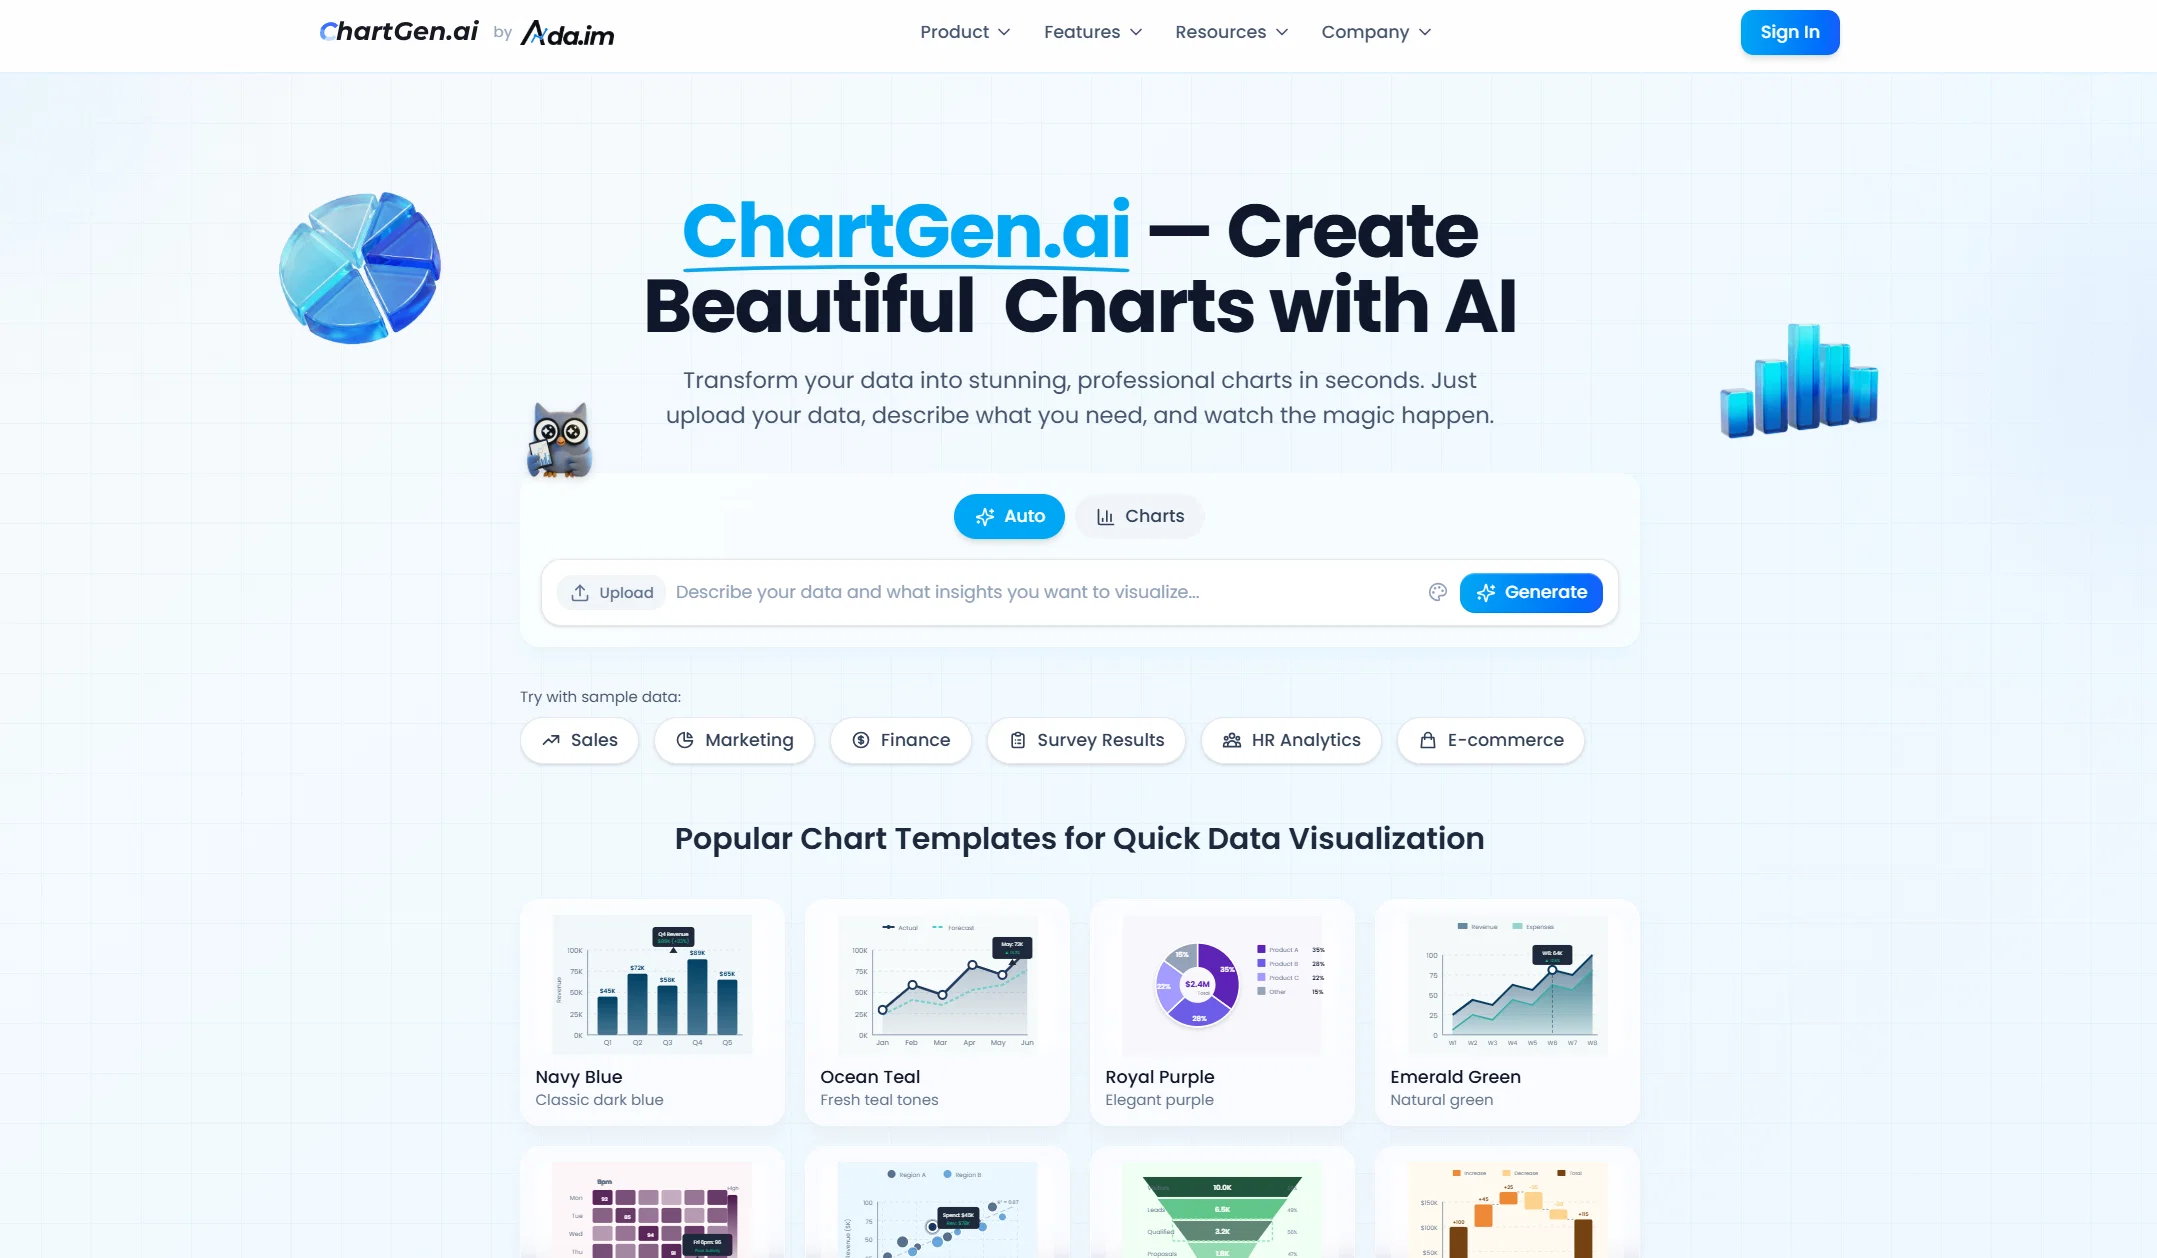
Screenshot gallery
Pros & Cons
Pros
- Zero Learning Curve, No Technical Skills Required
- Flexible Customization with AI Efficiency
- Built-in Data Insights, Not Just Charts
- Lightweight Entry with Scalable Growth
- Enterprise-Grade Security and Data Protection
- AI That Understands Both Data and Intent
- Automatic column type detection
- Zero learning curve
- No requirement for credit card
- Custom colors for charts
- Plain English chart description
Cons
- Advanced team collaboration features are limited
- No Python/R code export (No-code focus)
- Focuses on visualization over raw data cleaning
- Not designed for complex SQL database management
- Web-based only (No offline desktop version)
A Professional Framework to Evaluate ChartGen
When considering ChartGen for integration into your organizational workflow, we recommend deploying a structured score card across three critical operational pillars: Security & Compliance, Integration Friction, and long-term Price Scalability. Rather than looking only at basic feature lists, modern procurement teams must assess how a software platform behaves under high load and how well it fits into the team's data security guidelines.
1. Security and Database Compliance
Depending on your operating region and field, ensure that ChartGen supports standard security layers such as SOC 2 Type II certifications, GDPR compliance, or HIPAA-compliant database encryption. If the tool connects directly to client database tables or handles user passwords, verify that they implement multi-factor authentication (MFA), single sign-on (SSO) integrations, and end-to-end data encryption in transit and at rest.
2. API Coverage and Custom Integrations
Siloed data is the primary cause of operational friction. Evaluate if ChartGen has native connectors for your current project trackers, messaging hubs, and customer communication channels. For custom developer requirements, check if they provide a fully documented REST API with reasonable rate limits, comprehensive Webhooks support, and robust SDK packages in your language. A flexible API layer saves hundreds of hours of manual copy-paste overhead.
3. Total Cost of Ownership (TCO)
SaaS pricing packages are often deceptively simple. When reviewing ChartGen's billing structure, map out your team's projected expansion over the next 12 to 24 months. Determine how costs scale as your customer database increases or as you add team members. Factor in setup costs, mandatory support plan upgrades, API access fees, and storage overage rates to understand the true cost before committing to a contract.
By combining verified user reviews from our directory with internal workflow pilot tests, your procurement team can make an informed decision that drives productivity without creating capital waste.
Features of ChartGen
- API
- Chart Generator
- Data Visualization
- Chart Generation
- CSV Support
- Excel Support
SaaS1to10 verified reviews for ChartGen
Overall rating
Based on 24 reviews
No reviews yet. Be the first to write one.
Pricing
Starting Price
Contact vendor for pricing
Pricing may vary based on team size and features selected.
Where can ChartGen be deployed?
- Cloud, SaaS, Web-Based